Geographic information often requires specialist software for viewing and analysis. An additional challenge is the large data volume, especially in the case of point clouds. This poses a challenge for easy viewing and querying of this geographic information by the end user. Luckily, we now have the technology to view large data sets quickly and efficiently through a web interface.
Hai Performance provides three different web viewers for static geographic information. As always customization is possible. You can choose between hosting by Hai Performance or own your own infrastructure (on-premise).
Leaflet
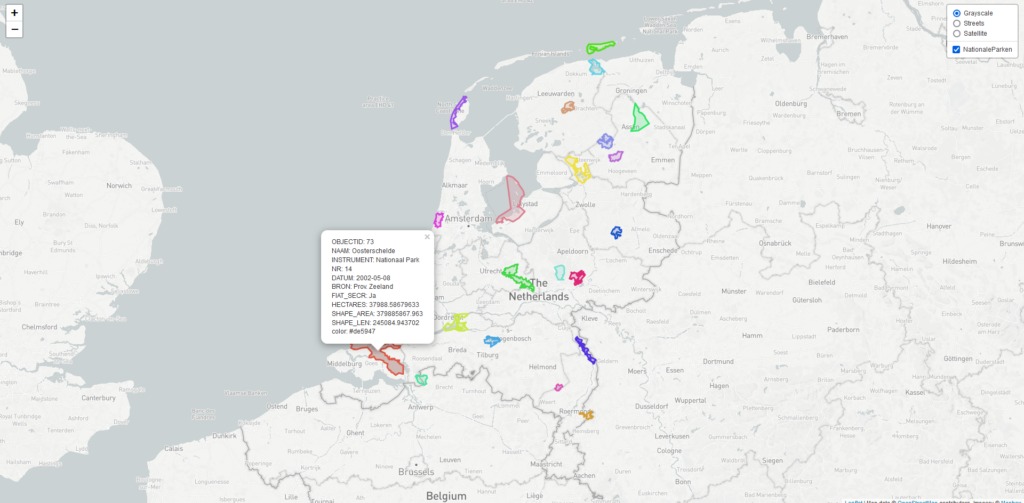
Leaflet is a lightweight viewer for 2D geographic information. Vector data can be shown on top of various base maps (Open Street Map, aerial imagery) and queried via mouse click. The data is provided in GeoJSON format, which can easily be generated with QGIS. The limitation to 2D and the possibility to show the position of the user makes Leaflet suitable for mobile applications. An example can be found here.
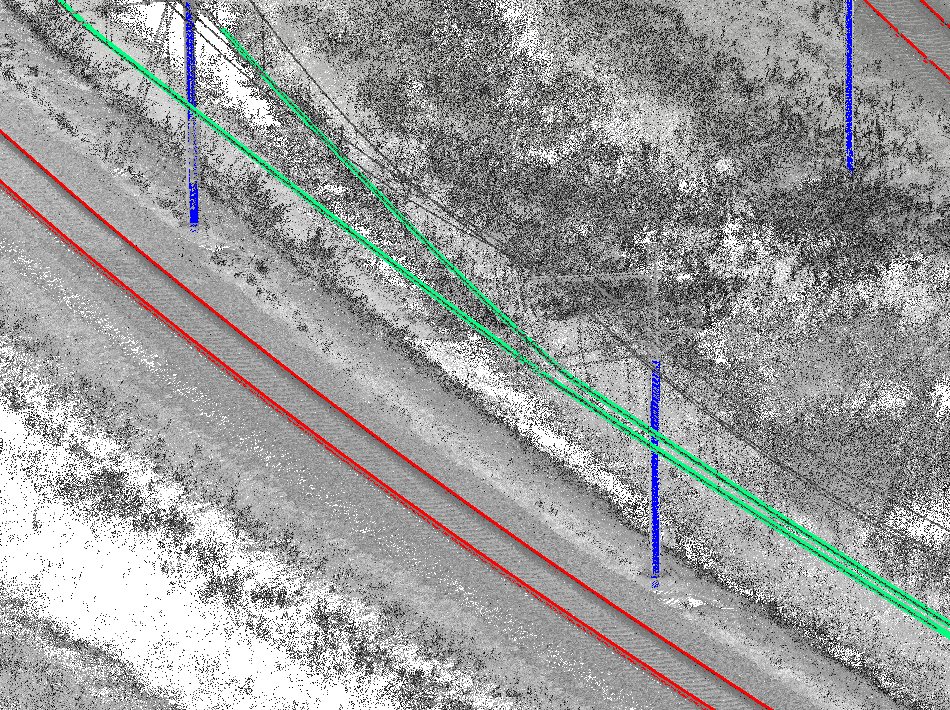
 Potree
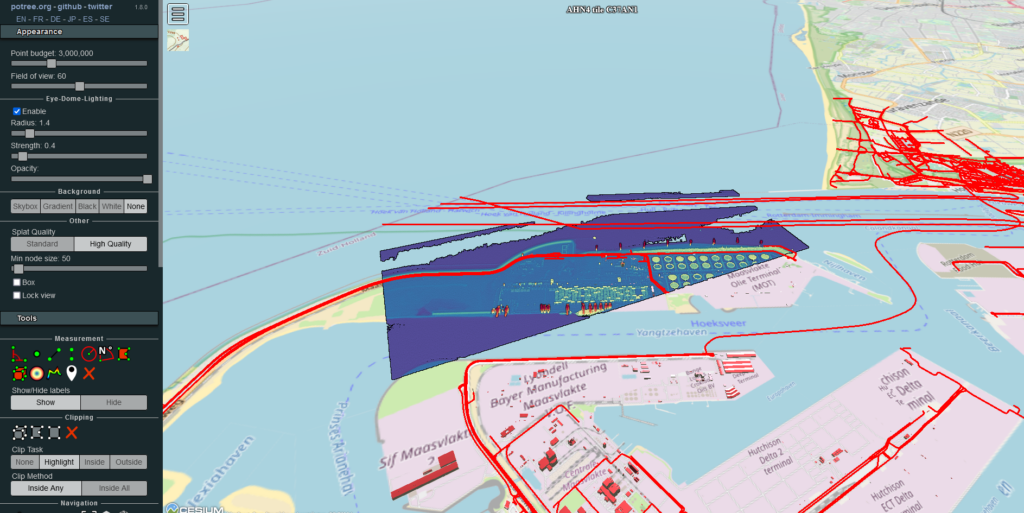
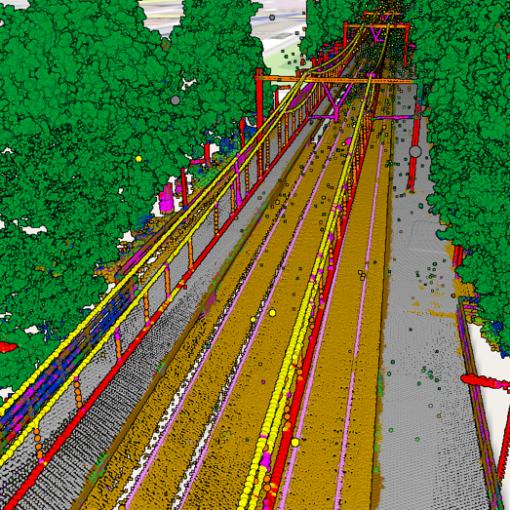
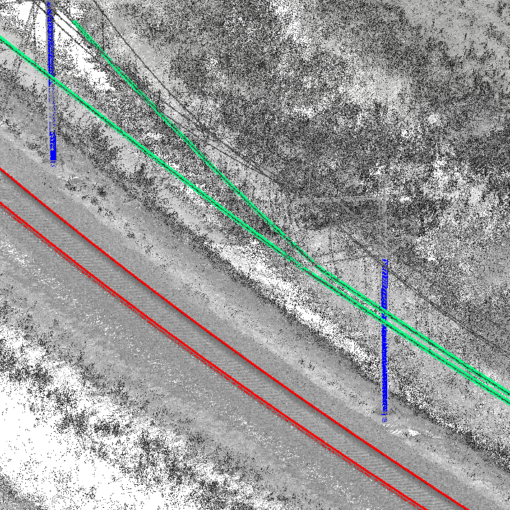
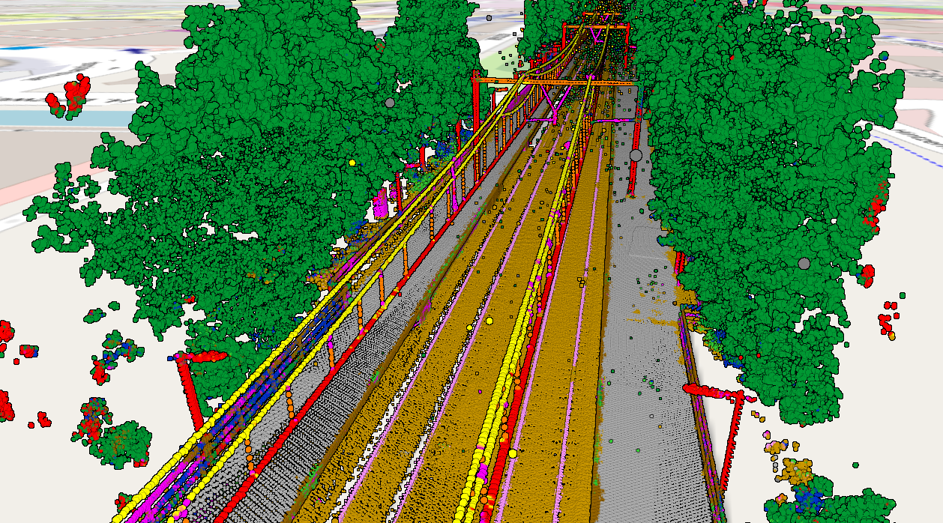
Potree is a 3D web viewer for point clouds. The possibilities for viewing and querying point clouds are extensive. It is possible to colour the points based upon all attributes. It is also possible to get coordinates and to do measurements, and even generate cross sections. It is also possible to show vector data and 3D models. The possibilities here are somewhat limited – larger 3D models slow the viewer down considerably, and not all vector data (provided as shapefile) works well. For point clouds it is the best web viewer available. An example can be found here.
Cesium
Cesium is a 3D web viewer, but also offers a full platform for the streaming of geographic information. This is by default filled with a terrain model, aerial imagery, and 3D buildings. Point clouds can be added as well, just like vector data in GeoJSON format. The performance is fine even with large 3D models. The attributes of 3D models and vector data can be queried via mouse click. It is even possible to add time stamps to the position of objects and play animations. Point cloud support is limited, there is e.g. no standard functionality for measurements. A difference with regard to Leaflet and Potree is that the data is hosted on Cesium’s server, which means higher costs for larger amounts of data (and traffic). But for 3D models Cesium is a nice solution. An example can be found here.
The right viewer for you
To sum it up, each viewer has a specific application:
- Leaflet: For the 2D presentation of vector data
- Potree: For the 3D presentation and analysis of point clouds, possibly extended with 3D models
- Cesium: For the 3D presentation of raster data, vector data, and 3D models, possibly extended with point clouds
I would be glad to help you with making the right choice, the implementation, and hosting if desired. Get in touch for more information.