Point clouds acquired through laser scanning with mobile mapping systems mounted on rail vehicles have become the de-facto standard for efficient large-scale mapping of rail infrastructure. Unfortunately, point clouds are large and unstructured heaps of data with a very low semantic information content. Getting useful information about assets from them requires considerable effort. Hai Performance has developed an approach to automated monitoring of rail assets from point clouds.
Below figure outlines the processing pipeline.
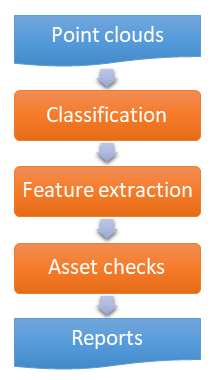
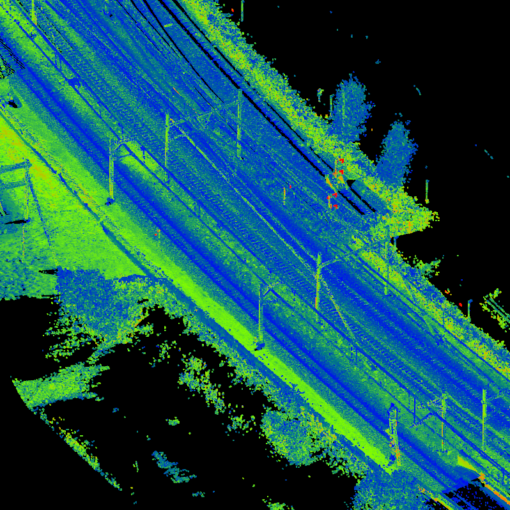
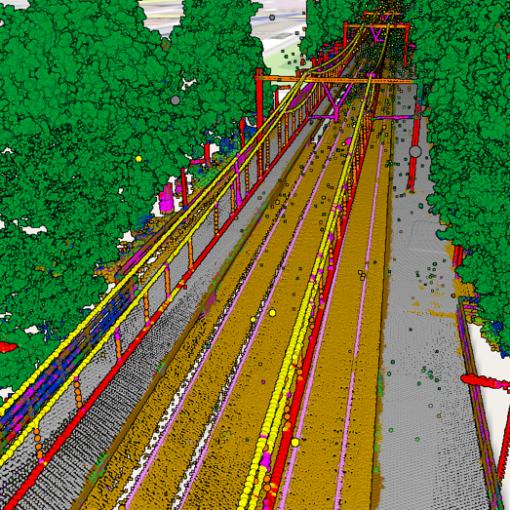
- The point clouds are classified using the machine learning approach developed by Hai Performance with a suitable classification model.
- Feature geometry is then extracted from the classified point clouds. The extracted features include rails, catenary wires, and trackside objects such as catenary poles, signals, and signs.
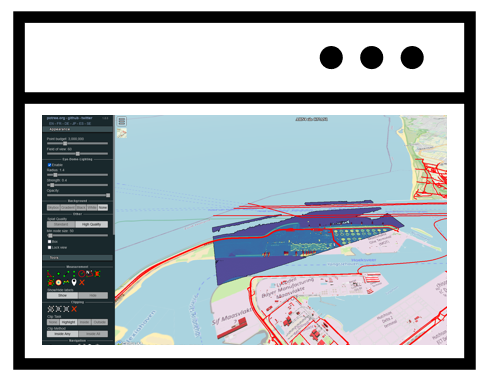
- The assets are checked against a list of requirements that results in reports of the condition of the detected assets in both tabular and visual form.
The results provide insight into the condition of multiple assets from a single data source, in a fully automated processing workflow.
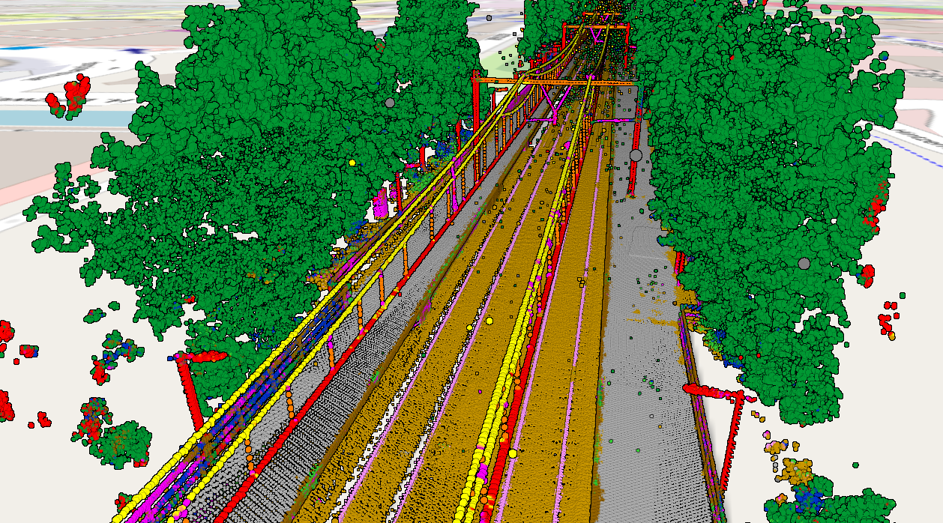
Classification
The point clouds are classified into 20 different classes that make it easy to identify and process assets. It is very easy to craft a custom classification model for specific needs.
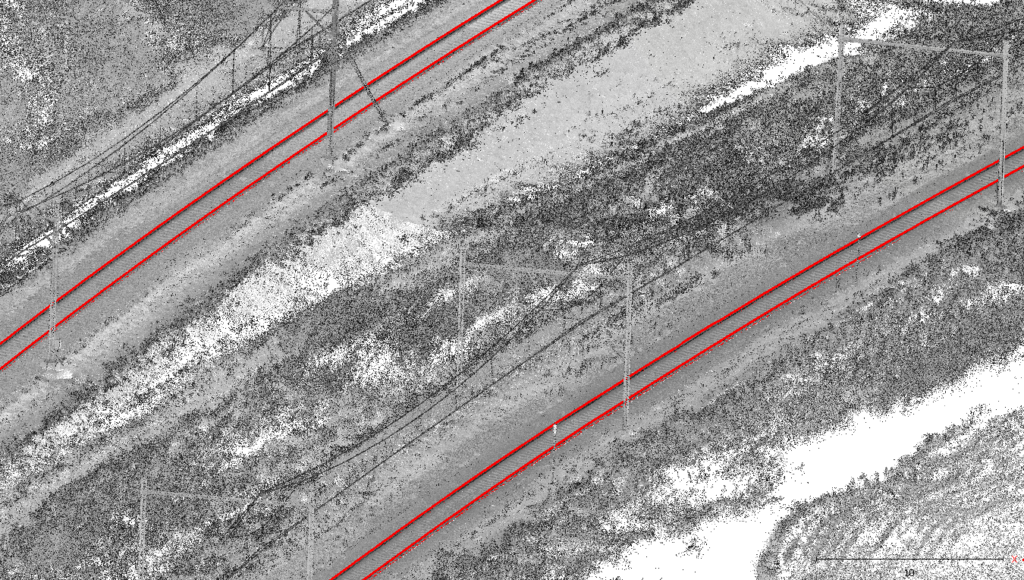
Track geometry
The rail and track geometry is extracted automatically from the classified point clouds. The track geometry can then be used for checking relative track alignment according to ProRail OHD00022 and detect issues that affect comfort and safety.

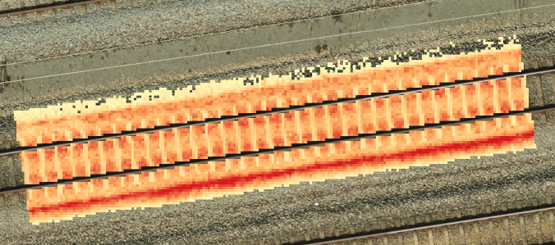
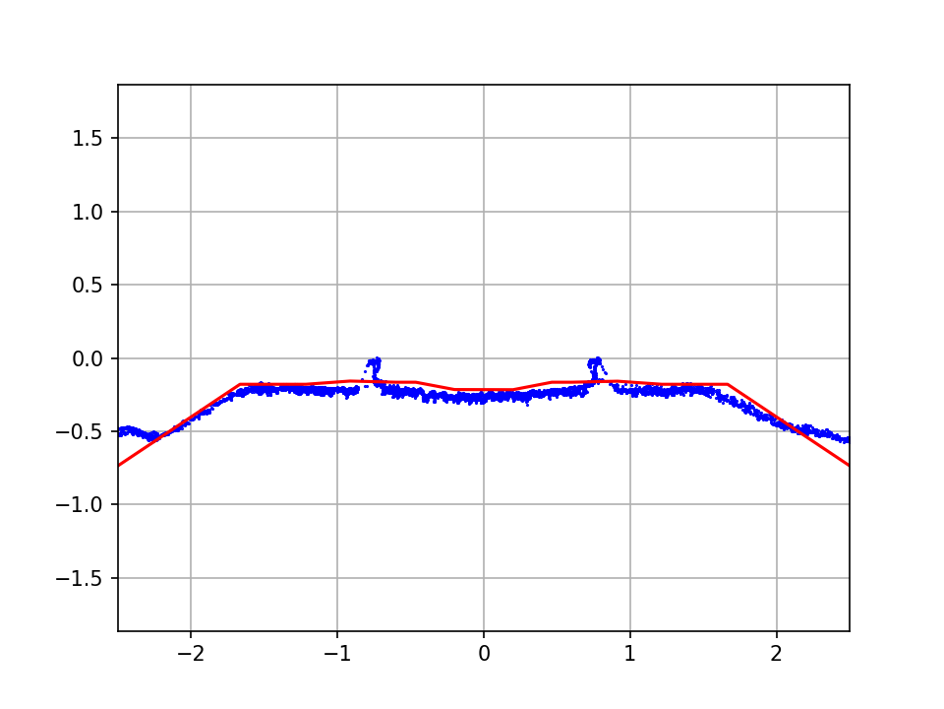
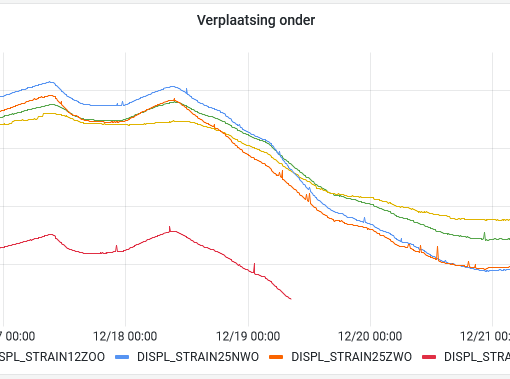
Ballast volume and profile
The extracted track geometry serves as reference for a check of the ballast profile according to ProRail OVS00045 and IHS00001. The check yields locations where there is insufficient ballast, and volumes of ballast surplus and shortages. The computation results are also presented as grids and cross sections for visualization and verification.
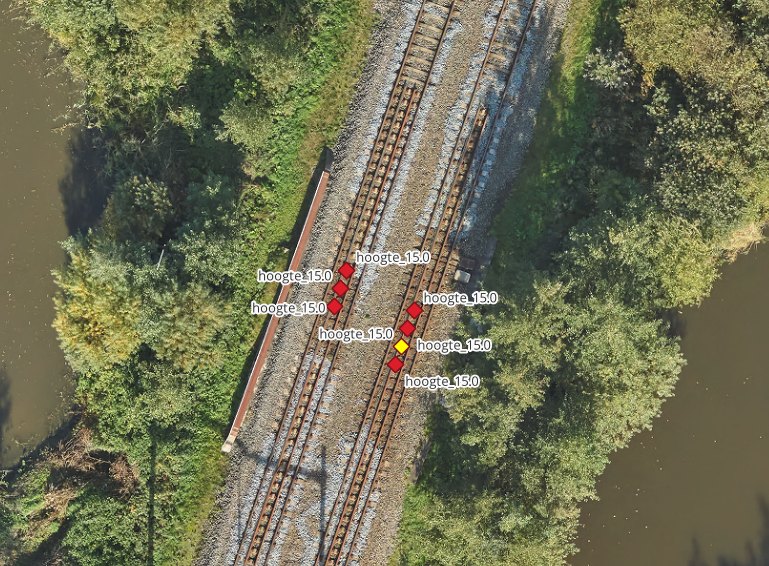
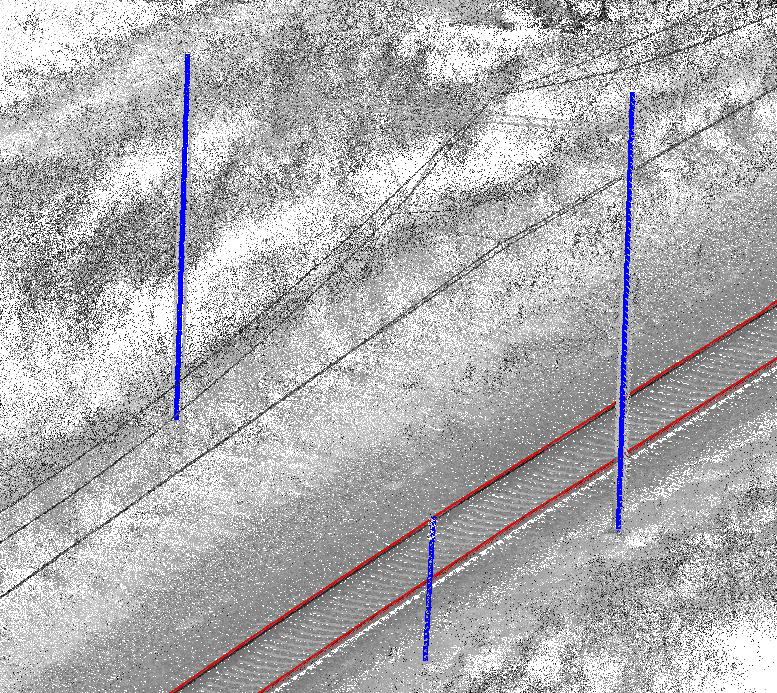
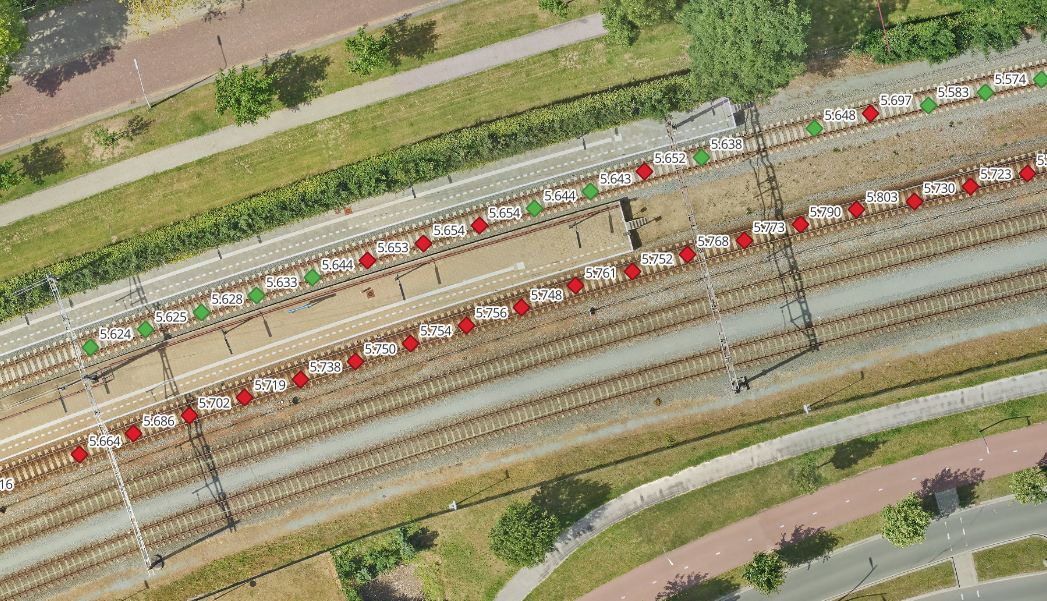
Trackside objects
From the classified point clouds trackside objects such as catenary poles, signs, and signals are extracted automatically and checked for verticality according to ProRail OVS00024 and OHD00033.

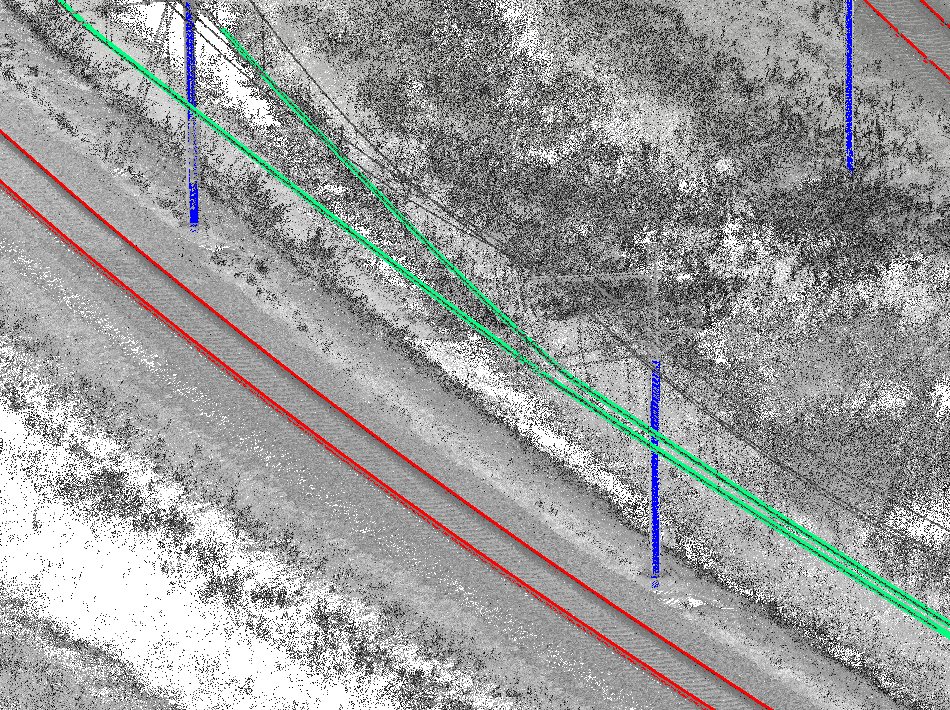
Catenary system
The contact wires are extracted automatically from the point clouds. The relative position of the contact wire to the track centreline is checked according to ProRail specifications OVS0024-5, OVS00024-9, OHD00033-3, and IHD00007-2. Additionally, section insulators are automatically detected. Their position and orientation is computed and checked against OHD00033-3, and IHD00007-2.