I started coding with Basic (on the Commodore 64, of course), but I consider myself mostly a C++ programmer. That’s the language I used throughout my time as university student and that I still use for […]
Blog
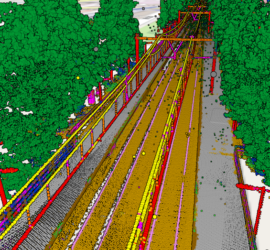
Okay, let’s be honest: Despite what the manufacturers of laser scanning equipment are trying to tell us, nobody really wants point clouds. They are huge blobs of unstructured and often noisy data with a low semantic […]
Linux/Windows dual boot works fine, but there are cases where this is not feasible. A computer may have to do most of its work under Windows because of certain application. When Linux is required, the Windows […]
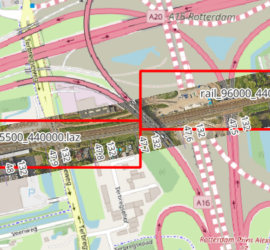
When you have many point cloud files that are not tiled, it can be tricky to find the one file that covers a certain geographic area. One way to deal with this is to construct the […]
I use the Windows Remote Desktop functionality all the time to connect to workstations. The Windows Remote Desktop client offers to store login credentials. Unfortunately, on a Pro version of Windows this doesn’t work due to […]
Throughout the years Windows has received much criticism for security issues. As a result, default settings can be a bit too secure. One thing that always bugs me are the notifications that a file is potentially […]
I’ve been using WSL for running Linux-only software and it works really well, but there are cases (especially when graphical output is needed) where a native Linux system is required. Lately I’ve taken advantage of the […]
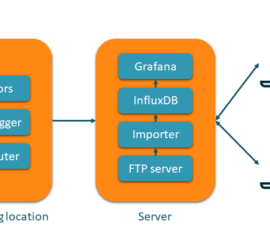
Geodetic and geotechnical monitoring is an important task within the field of surveying. It is often employed to monitor critical buildings and infrastructure during construction works. One of the highlights of my geodetic career was the […]
So you’ve digitized lines in QGIS into a shapefile, but want to save the vertices as ASCII file to do other stuff with them? This is not as straightforward as it might seem at first. The […]


