I’ve long been interested in using game engines as tool for visualising and analyzing geographic information. A couple of years ago I played with Unity. I liked how well integrated with C# it was and how […]
Blog
77 Beiträge
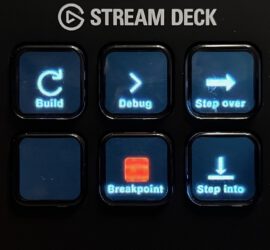
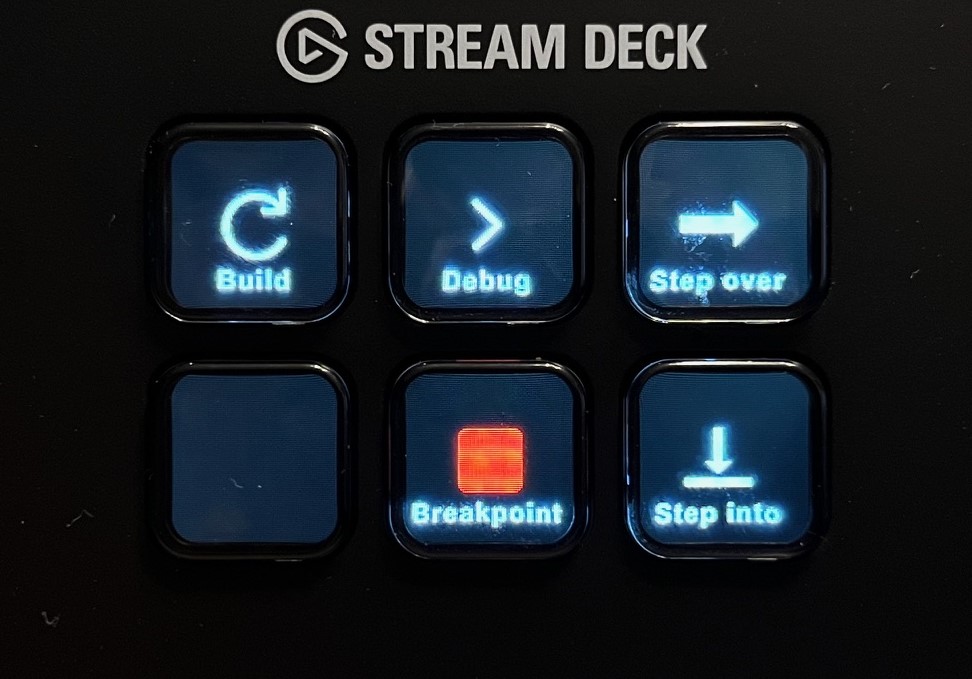
I’ve recently acquired an Elgato Stream Deck Mini after reading about it in German computer magazine C’t. For those who are not familiar with the Stream Deck, it’s essentially a programmable macro pad, but with the […]
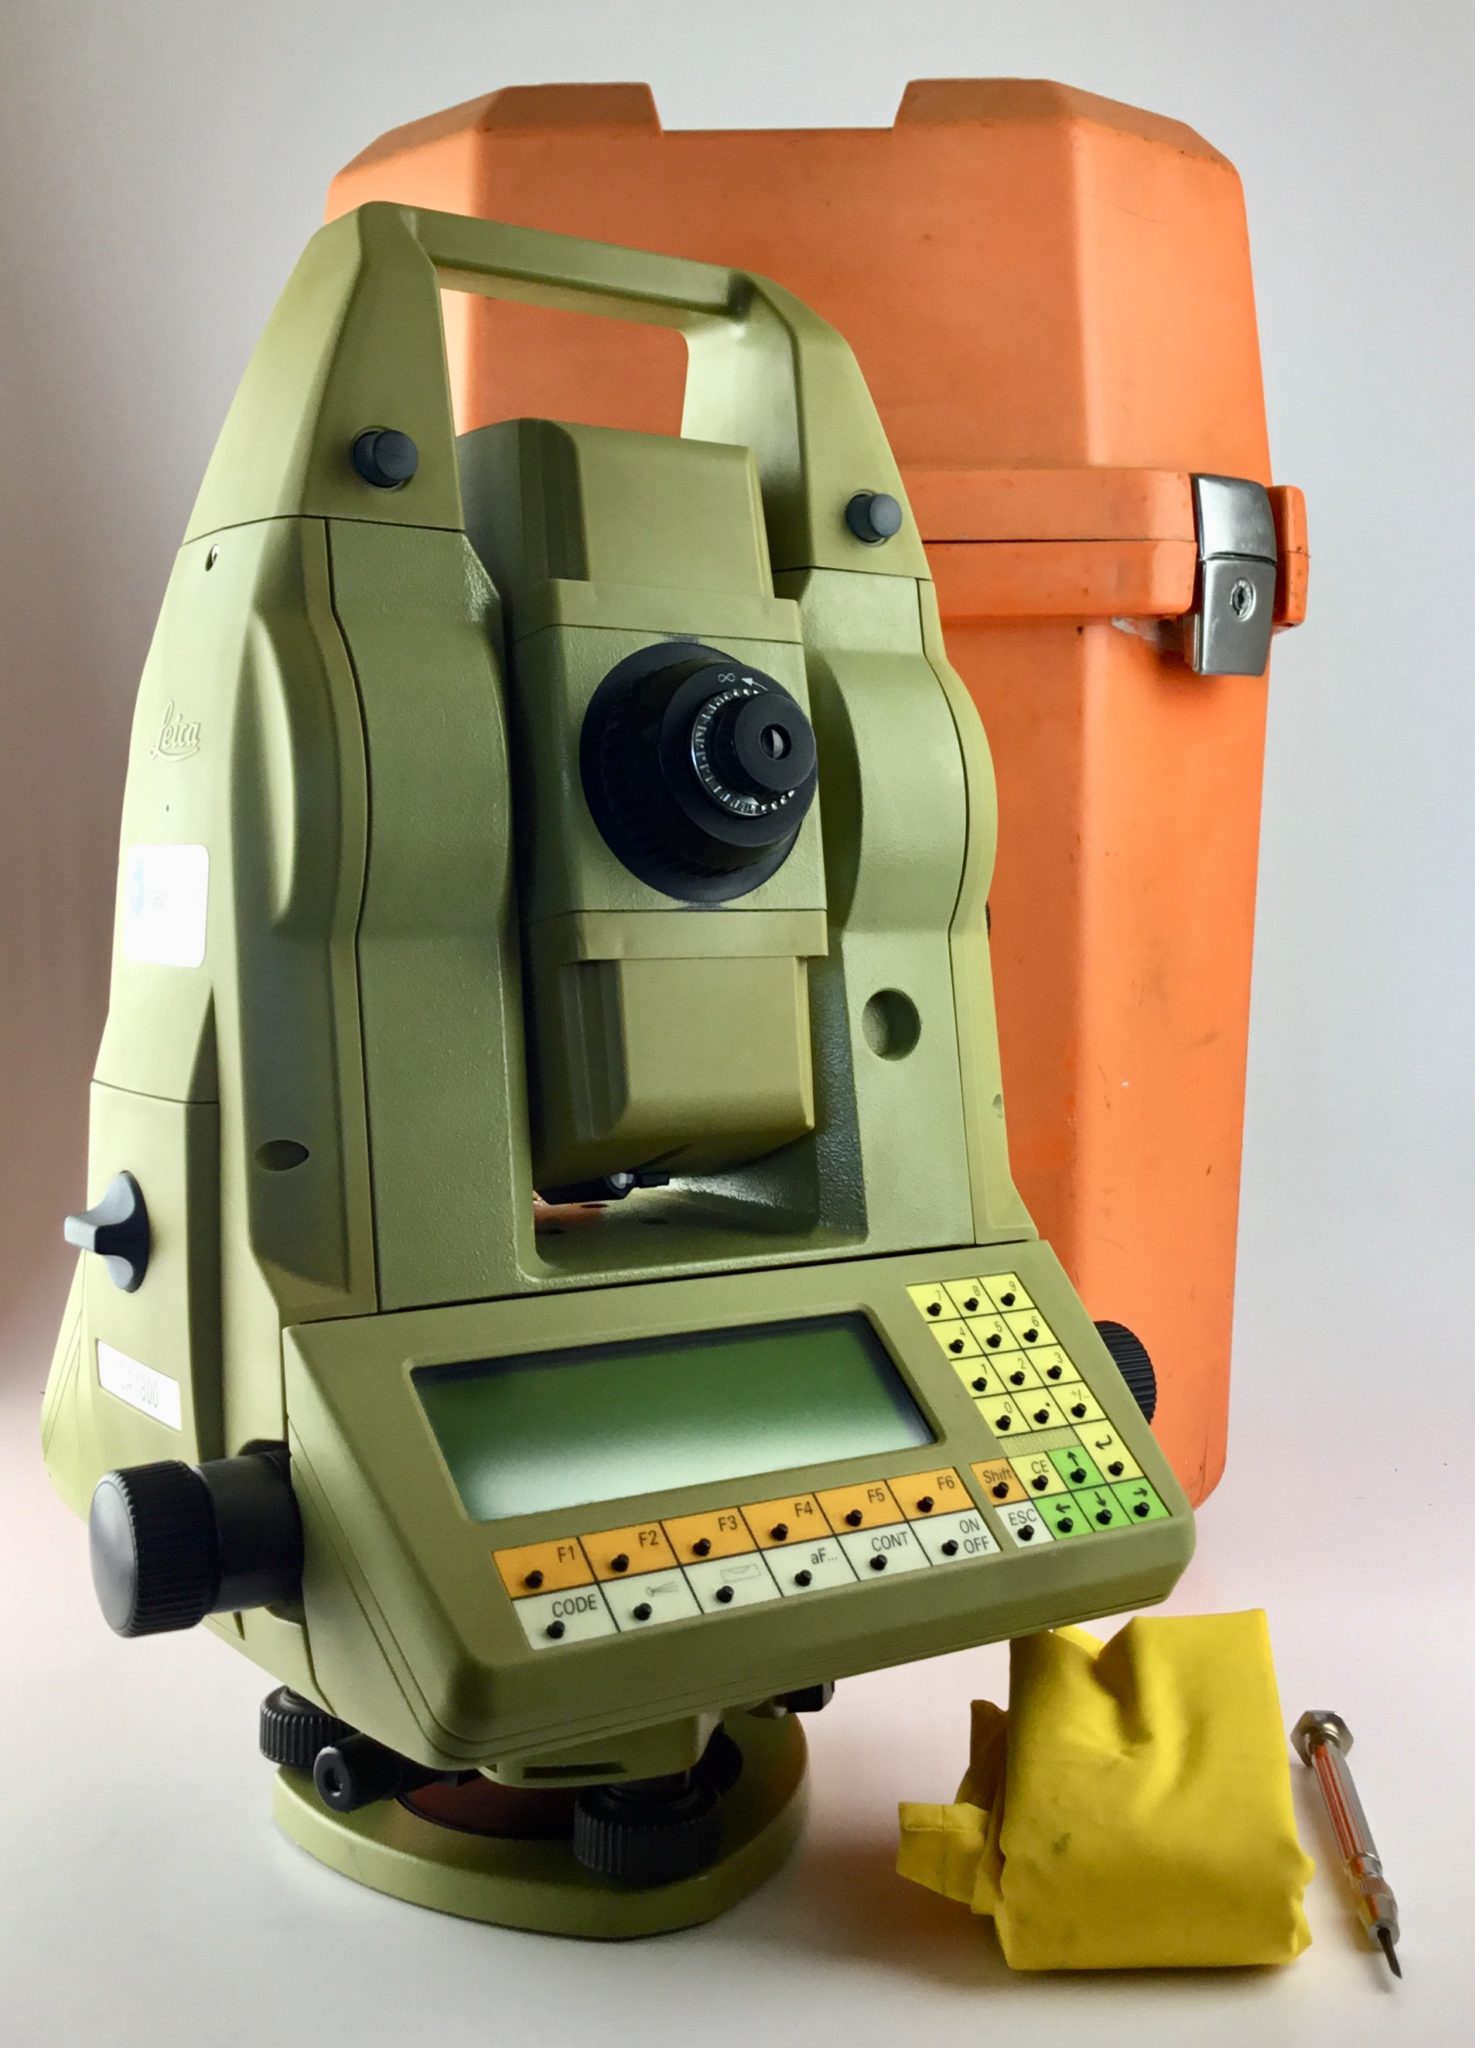
This article is available in three languages, so make sure to choose your preferred language on the right. 2024 ist ein Jahr mit mehreren fünfjährigen Jubiläen für mich. Dabei rede ich nicht vom 70. Geburtstags meines […]
I started coding with Basic (on the Commodore 64, of course), but I consider myself mostly a C++ programmer. That’s the language I used throughout my time as university student and that I still use for […]
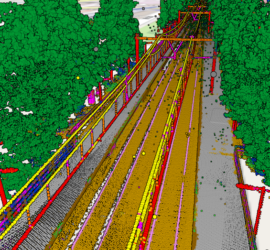
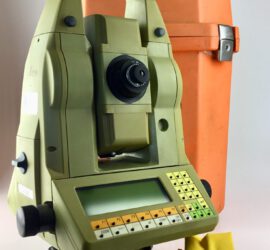
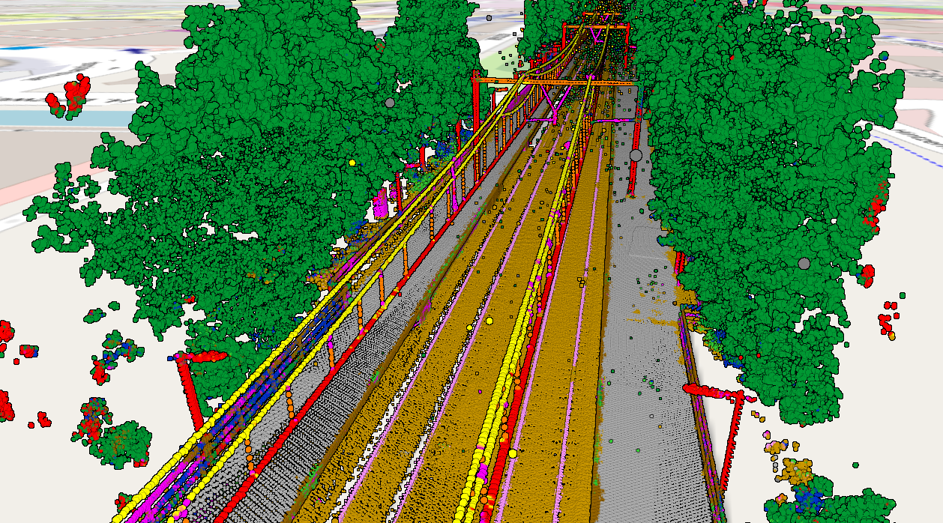
Okay, let’s be honest: Despite what the manufacturers of laser scanning equipment are trying to tell us, nobody really wants point clouds. They are huge blobs of unstructured and often noisy data with a low semantic […]

Linux/Windows dual boot works fine, but there are cases where this is not feasible. A computer may have to do most of its work under Windows because of certain application. When Linux is required, the Windows […]
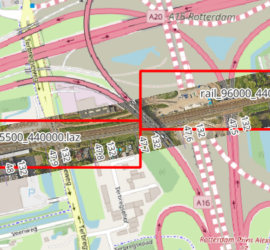
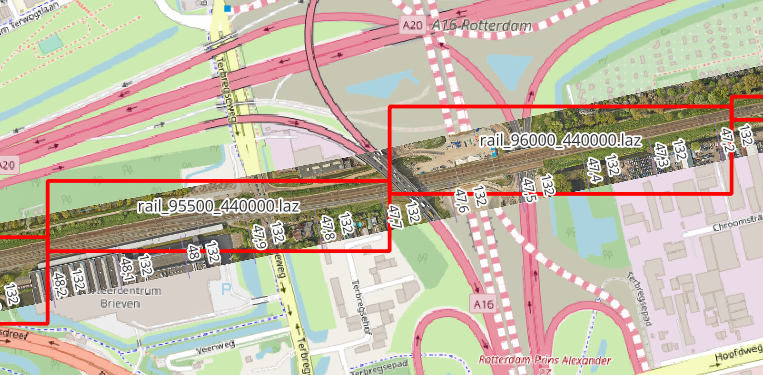
When you have many point cloud files that are not tiled, it can be tricky to find the one file that covers a certain geographic area. One way to deal with this is to construct the […]
I use the Windows Remote Desktop functionality all the time to connect to workstations. The Windows Remote Desktop client offers to store login credentials. Unfortunately, on a Pro version of Windows this doesn’t work due to […]
Throughout the years Windows has received much criticism for security issues. As a result, default settings can be a bit too secure. One thing that always bugs me are the notifications that a file is potentially […]