One of the advantages of QGIS is how well it integrates Python. There’s a Python console, but more importantly it is possible to expand QGIS with Python plugins. These come in two flavours: GUI plugins have […]
admin
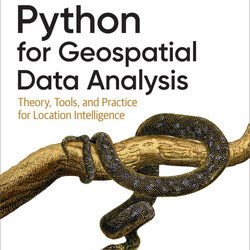
When I saw the announcement for this book on the O’Reilly website, I knew immediately that I had to get it. My programming background is in C/C++/C# and I’ve only been using Python for a year […]
InfluxDB and Grafana are designed for storage and display of one-dimensional time series data. There is however an XY Chart option in Grafana that also makes it possible to show two-dimensional data. There are several challenges […]
InfluxDB is a database for time series data, and I have recently been developing an application for geodetic and geotechnical monitoring around it. My input data is usually in text form. There are several ways to […]
Geopandas is an extension to the powerful Pandas library for Python that adds support for geographic data, including reading and writing ESRI shapefiles, which are one of the most common formats for vector geometry with attribute […]
When processing time series in Octave, you probably have timestamps to deal with. I recently had data with timestamps formatted like „25-9-2022 19:17“. Reading data like this from a file can be done with the textscan […]
As I considered my previous backpack too heavy, I decided to go looking for a new one – the challenge being that there are countless possibilities. My list of requirements was relatively short: Space for a […]
Here are a couple of Windows tools that I find extremely useful. WinMerge Have you ever tried to manually find the differences between two text files, such as different versions of a piece of code or […]
I’ve long worked without a code versioning system – mostly because I usually work on a project alone. For a couple of years now I’ve regularly synced most of my code to Google Drive as backup […]


