I started coding with Basic (on the Commodore 64, of course), but I consider myself mostly a C++ programmer. That’s the language I used throughout my time as university student and that I still use for […]
Blog
89 berichten
Het is het einde van het jaar, tijd dus om WBSO voor 2024 aan te vragen. WBSO staat voor Wet Bevordering Speur- en Ontwikkelwerk en is een laagdrempelige subsidiepot van de RVO. WBSO is een korting […]
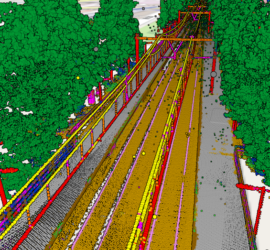
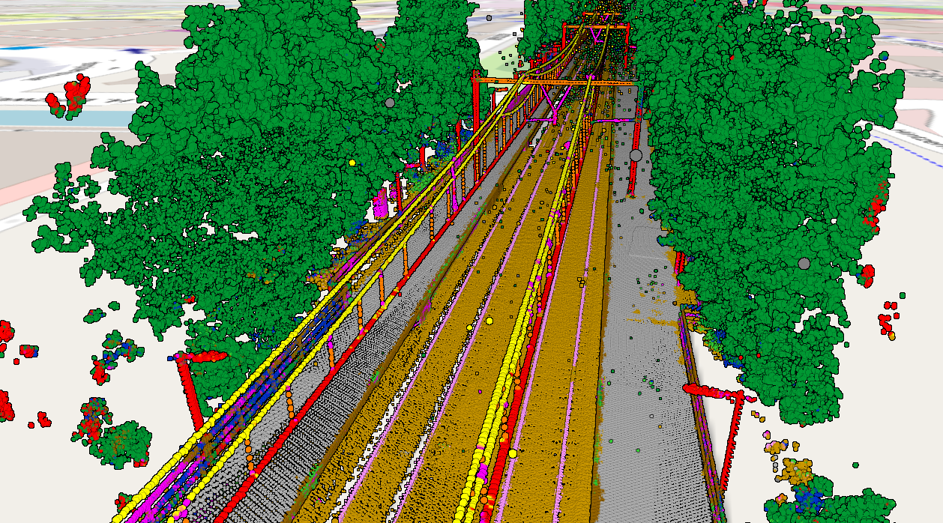
Okay, let’s be honest: Despite what the manufacturers of laser scanning equipment are trying to tell us, nobody really wants point clouds. They are huge blobs of unstructured and often noisy data with a low semantic […]
Linux/Windows dual boot works fine, but there are cases where this is not feasible. A computer may have to do most of its work under Windows because of certain application. When Linux is required, the Windows […]
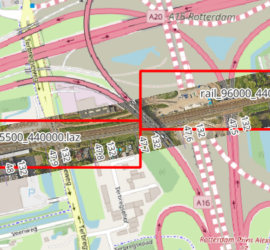
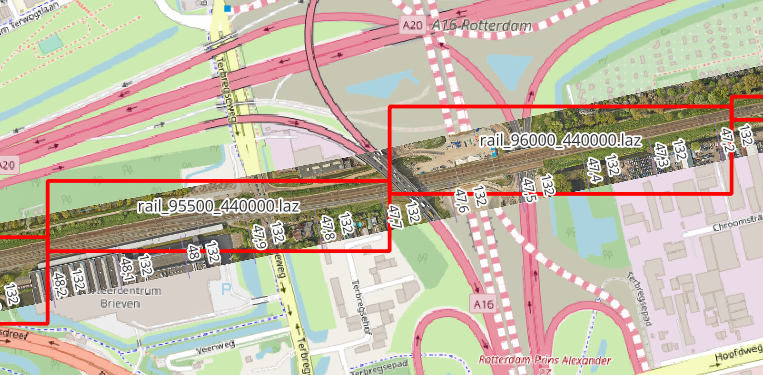
When you have many point cloud files that are not tiled, it can be tricky to find the one file that covers a certain geographic area. One way to deal with this is to construct the […]
I use the Windows Remote Desktop functionality all the time to connect to workstations. The Windows Remote Desktop client offers to store login credentials. Unfortunately, on a Pro version of Windows this doesn’t work due to […]
Throughout the years Windows has received much criticism for security issues. As a result, default settings can be a bit too secure. One thing that always bugs me are the notifications that a file is potentially […]

Je zit er dus over na te denken om freelancer te worden. De beweegredenen daarvoor kunnen verschillen. Misschien wil je meer vrijheid, of voor een meer diverse groep klanten werken. Of je denkt op deze manier […]
I’ve been using WSL for running Linux-only software and it works really well, but there are cases (especially when graphical output is needed) where a native Linux system is required. Lately I’ve taken advantage of the […]