Geodetic and geotechnical monitoring is an important task within the field of surveying. It is often employed to monitor critical buildings and infrastructure during construction works. One of the highlights of my geodetic career was the monitoring of the first Coentunnel during the construction of the second tunnel. The monitoring system will usually contain various different sensors. Some measure relative values (such as inclinometers and extensiometers), others like total stations can directly survey absolute 3D coordinates, albeit at a lower frequency. During some phases of the construction work there might even be a requirement for real-time capability.
The software side traditionally consists of datalogging software, a (relational) database for storing the measurements, from which they can be accessed for analysis, visualisation, reporting, and alerting, plus custom software that provides this functionality.
But there are new software solutions that make it possible to achieve similar functionality with very little custom code. The layout of such as system is shown below:
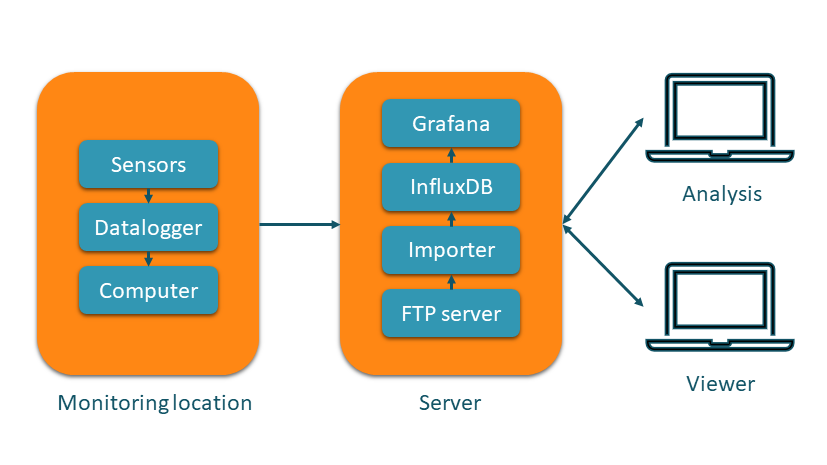
At its core sits InfluxDB. InfluxDB is a database built explicitly for the storage of time series, with a typical application being the monitoring of network or server infrastructure. InfluxDB offers many possibilities for ingesting data. For monitoring, a typical setup would consist of a computer on location that gathers the measurements and forwards them via ftp as text files. I found that the easiest way to get these into InfluxDB is with the Python API (the Importer part in the diagram above), which can be fed Pandas dataframes:
client = InfluxDBClient(url="https://www.example.nl:8086", token="influxdb_token", org="HaiPerformance",debug=False)

write_api = client.write_api(write_options=SYNCHRONOUS)

fixtags={"sensor":"sensorname"}

write_api.write(bucket,"HaiPerformance",record=data,data_frame_measurement_name="monitoring",data_frame_timestamp_colum="Timestamp",tags=fixtags)

write_api.close()

client.close()
Using Python makes it possible to do all kinds of pre-processing on the data before storing it in the database. Given Python’s popularity in the field of data science and machine learning, it is easy to implement all kinds of filtering. The Python API can of course also be used for accessing data from the database (once again as Pandas dataframe) and hence you can use it for analysing stored data and reporting.
InfluxDB comes with a web interface for configuration and some basic visualization capabilities, but the best option for visualization is probably Grafana. Grafana can directly access InfluxDB, offers a large variety of interactive plots (including maps), and is fully configured through a web interface. Important for monitoring is that it also offers several different possibilities for alerting.
InfluxDB is queried using the Flux query language, which offers functionality for sampling and filtering data, such as getting the median or mean of all values in a given interval:
from(bucket: "demo2")

|> range(start: v.timeRangeStart, stop: v.timeRangeStop)

|> filter(fn: (r) => r["_measurement"] == "monitoring")

|> filter(fn: (r) => r["_field"] == "z")

|> aggregateWindow(every: v.windowPeriod, fn: mean, createEmpty: false)

|> yield(name: "mean")
Essentially the same query, just with the time range and interval explicitly specified, could be used with the Python API.
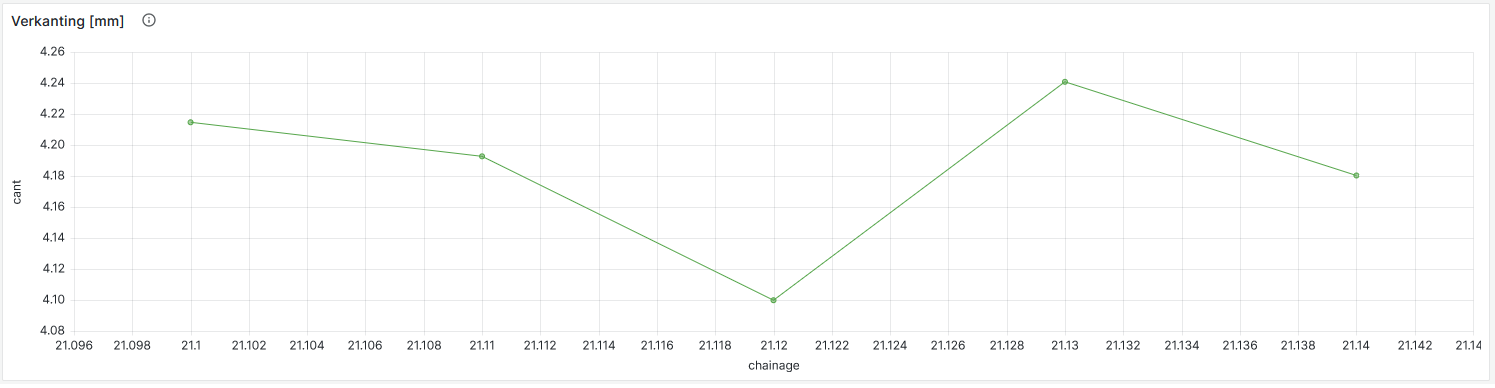
XY plots like the one shown below took me a bit more time to figure out, but these are possible to (showing, of course, only one epoch).
from(bucket: "demo2")

|> range(start: v.timeRangeStart, stop:v.timeRangeStop)

|> filter(fn: (r) => r["_measurement"] == "monitoring")

|> filter(fn: (r) => r["point"] == "201" or r["point"] == "202" or r["point"] == "203" or r["point"] == "204" or r["point"] == "205")

|> last()

|> pivot(rowKey:["_time"], columnKey: ["_field"], valueColumn: "_value")

|> group()
The Flux code for a map plot would be the same.
Maybe best of all, all of the software mentioned here is available for free and runs under Linux. This makes it possible to set up all software on an affordable virtual machine with one of the many providers of IaaS cloud services. Be careful though with regard to the availability guaranteed by the provider, especially for projects where availability is critical.


