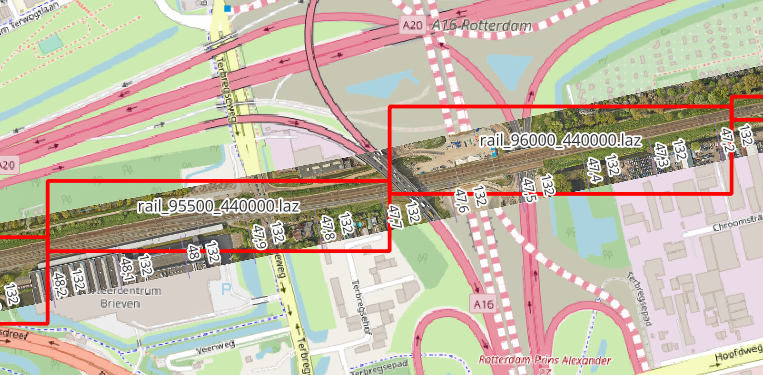
When you have many point cloud files that are not tiled, it can be tricky to find the one file that covers a certain geographic area. One way to deal with this is to construct the boundary of a file by reading all points and constructing e.g. the convex hull. This is however quite time intensive. LAStools’ lasboundary can do this, but it’s not one of the tools that is free.
There’s an alternative though. Each LAS/LAZ file has a header that contains the minimum and maximum extents in all three dimensions. This is of course only a rectangular bounding box, so it will not be very useful in case of very long point clouds that run diagonal with regard to the coordinate system. But for relatively small clouds this is by far the easiest and quickest way to get the approximate coverage.
Installing pylas
Reading LAS with Python can be done with the pylas package. This is not installed by default with the Python distribution that comes with QGIS. This can, as usual, be done with pip. By opening the OSGeo4W Shell that will have been added as start menu item when you installed QGIS via OSGeo4W, you ensure that you are within the correct Python environment. Then run
pip install pylas[lazrs,laszip]
Reading the bounding boxes
You can download the Python script here. Open it with the QGIS Python console to run in, and set the proper path to your LAS/LAZ files.
Reading the bounding boxes is pretty straightforward. The header contains the minimum and maximum extents, from this the four corner points can be constructed. These are then used for a Polygon. I’ve only added the filename as attribute, but you could easily add the folder and other header information, such as the file format or number of points. The header module is described here.

